
Health inequalities
How will health inequalities develop in the future?
This section of the Trend Scenario shows how health inequalities will develop in the future. It will look at health inequalities in relation to education, income, gender, age, employment and municipality. Questions that will be explored are: how do inequalities in life expectancy develop? And what are the inequalities in perceived health? What lifestyle inequalities will there be the future? The aim of the Trend Scenario is to identify future societal challenges for public health and health care. The Trend Scenario is not a prediction but rather an exploration of possible developments between now and 2040. It is based on the continuation of historical trends with no new policies being implemented. The projections take into account future population growth and changes in the age composition of the population (population ageing). Wherever relevant and possible, it also includes future changes in the occurrence of, for example, diseases and determinants. The Trend Scenario is based on assumptions about how trends will continue over the next 25 years. However, how these will evolve is uncertain. The Trend Scenario presents just one of the possible future scenarios. The background document about the methods provides further information about the uncertainties concerning the projections.

The main developments in the Trend Scenario
Question 1: What are the trends in inequalities in life expectancy?
- The difference in life expectancy between people of low and high socio-economic status remained around seven years during the period 2004-2014; it is uncertain how this difference will develop in the future.
- The difference in life expectancy in perceived good health between people of low and high socio-economic status plateaued at around 18 years during the period 2004-2014; it is uncertain how this difference will develop in the future.
Question 2: How will inequalities in perceived health develop in the future?
- The percentage of people of low socio-economic status who feel healthy will decrease by 2040, whereas this will remain unchanged for people of high socio-economic status.
- The vast majority of people with a chronic disease will feel healthy and experience no activity limitations up to the age of 75 years. After that age poor health and activity limitations will increase. It is uncertain how these differences will develop in the future.
- Flex-workers feel less healthy and satisfied with their life than people on a permanent contract; it is uncertain how these differences will develop in the future.
Question 3: How will inequalities in the burden of disease develop in the future?
- For women the leading cause of disease burden will shift from stroke in 2015 to dementia in 2040; for men the leading cause of disease burden was and will be coronary heart diseases.
Question 4: How will inequalities in lifestyle develop in the future?
- The percentage of people who are overweight will increase by 2040 in all socio-economic groups.
- The percentage of people who are obese will increase at a faster rate among people of low socio-economic status than among people of high socio-economic status.
- The percentage of people who smoke occasionally will decrease in all socio-economic groups, but in 2040 this percentage will be three times as large among people of low socio-economic status compared with people of high socio-economic status.
Question 5: How will regional inequalities in health and the determinants of health develop in the future?
- In 2040, life expectancy will still be at its lowest in several major cities and areas with a shrinking population.
- Air quality will improve in the future; local differences will remain.

What are the trends in inequalities in life expectancy??
The higher the household income, the higher life expectancy at birth. During the period 2011-2014, life expectancy of people in the highest income group was around 84 years. Among the group with the lowest income this was around 77 years, a difference of 7 years. This is true for both men and women, although women in all income groups have a slightly higher life expectancy at birth than men (not shown in figure). In all income groups life expectancy increased between 2004 and 2014. The absolute differences in life expectancy between income groups remained virtually the same during this period. Another commonly used indicator for socio-economic health inequalities is educational level. During the period 2011-2014 the difference in life expectancy between low-educated and high-educated people was over six years (not shown in graph).
It is not certain how the increase in life expectancy will develop in the future for different socio-economic groups. The educational level of the Dutch population is expected to increase over the next few decades. As a consequence the composition of the group of low-educated people will change, which may possibly result in a concentration of risk factors for poorer health in this group. Yet, the increase in educational level could also result in the group of better educated people becoming more heterogeneous as regards the risk factors for health. It is uncertain what the consequences of this will be for differences in life expectancy between low-educated and high-educated people.
ndicator(s) used: Average life expectancy at birth in the periods 2004-2007, 2007-2010, and 2011-2014 by standardised disposable household income.
Source(s) used (in Dutch): Statistics Netherlands (CBS) Social Statistical Database 2003- 2014; Municipal Personal Records Database 2004-2014.
Further information:
- Methods and backgrounds.
- Reference framework 2015, Ministry of Education, Culture and Science (in Dutch).
- Trend Scenario section 'How old will we get in the future?'
- Life expectancy at birth by educational level ( in Dutch) at Volksgezondheidenzorg.info.
- CBS: Life expectancy by educational level (in Dutch).
The higher the household income, the higher life expectancy in perceived good health at birth. This is true for both men and women. The differences in life expectancy in perceived good health between income groups remained almost the same between 2004 and 2014. In the period 2011-2014 the difference between the lowest and the highest income groups was 18 years. In these years, the difference in life expectancy in perceived good health between low-educated and high-educated people was almost 19 years (not shown in graph). In the Trend Scenario, differences in perceived good health between low-educated and high-educated people will increase in the future (see next graph). However, how socio-economic differences in life expectancy in perceived good health will develop in the future remains to be seen.
Indicator(s) used: the average life expectancy in perceived good health at birth in the periods 2004-2007, 2007-2010 and 2011-2014 by standardised disposable household income.
Source(s) used (in Dutch): Statistics Netherlands (CBS) Social Statistical Database 2003-2014; Municipal Personal Records Database 2004-2014; CBS Health Survey 2004-2014.
Further information:
- Methods and backgrounds.
- Reference framework 2015, Ministry of Education, Culture and Science (in Dutch).
- Trend Scenario section 'How old will we get in the future?'
- Life expectancy at birth by educational level ( in Dutch) at Volksgezondheidenzorg.info.
- CBS: Life expectancy by educational level (in Dutch).
There are substantial differences in life expectancy in perceived good health between socio-economic groups
How will inequalities in perceived health develop in the future?
Low-educated people feel less healthy than high- educated people. The Trend Scenario shows that the percentage of low-educated people aged 25 years and over who feel healthy will decrease in the future, whereas this percentage will remain reasonably stable for high-educated people. The percentage of low-educated women who feel healthy will fall by more than the percentage of low-educated men (not shown in graph). Approximately 80 percent of the total population felt healthy in 2015 and will do so in 2040 (not shown in graph either).
Indicator(s) used: Percentage of Dutch people (25+) who regard their health status in general as (very) good by educational level.
Source(s) used (in Dutch): Statistics Netherlands (CBS) Health Survey (1990 t/m 1996); POLS health and wellbeing (1997-2009); CBS Health Survey (2010-2014); data processed by RIVM.
Further information:
- Methods and backgrounds.
- Trend Scenario section 'How healthy will we be in the future?'
Approximately 20 percent of people aged 70-74 years who have a chronic disease feel unhealthy and experience activity limitations. This goes for both men and women, although a slightly larger number of women with a chronic disease feel unhealthy and experience activity limitations. Above 75 years activity limitations and poor health increase quickly for both women and men: in the age group 85 years and older almost 40% of men and over 50% of women who have a chronic disease feel unhealthy and experience activity limitations. These are perceived limitations due to vision, hearing and/or mobility impairments. The number of old and very old people will increase in the future. Partly as a result of this the proportion of people who have chronic diseases will increase (not shown in graph). Hence the number of old people with chronic diseases who also have perceived poor health and activity limitations will also increase in the future.
Indicator(s) used: Percentage of Dutch people (16+) who perceive themselves to have at least one chronic disease, one or more activity limitations due to vision, hearing and mobility impairments and who perceive their health as being less than good.
Source(s) used (in Dutch): Adults Health Monitor, Health Services, Statistic Netherlands (CBS) RIVM, 2012, data processed by RIVM.
Further information:
- Methods and backgrounds.
- Trend Scenario section 'How healthy will we be in the future?'
Over the last few years, the proportion of self-employed people and flex-workers (employees not on a permanent contract) in the labour force has risen, and the proportion of employees on a permanent contract has fallen. Flex-workers slightly more often judge their health to be less good and/or are slightly less often satisfied with their life than employees on a permanent contract. This is the case above all among the group of flex-workers with a lower than average income. This income group is also larger among flex-workers than among the self-employed and people on a permanent contract. The health and life satisfaction perceived by the self-employed is comparable to that of permanent employees. Evidently, flex-workers and the self-employed often experience greater job insecurity than permanent employees. This insecurity is more likely to affect flex-workers and thus their wellbeing
It is uncertain how the relationship between health, life satisfaction, income and type of employment contract will develop in the future. This will depend in part on how the flexibilisation of the labour market will develop over the next 25 years.
Indicator(s) used: Income: Average disposable household income (standardised); Wellbeing: Life satisfaction and perceived health (18 years and over).
Source(s) used (in Dutch): Statistics Netherlands (CBS), Quality of Life in the Netherlands, The Hague, 2015.
Further information:
- Methods and backgrounds.
- Trend Scenario section 'How healthy will we be in the future?'
An increasing proportion of low-educated people will feel unhealthy in the future

How will inequalities in the burden of disease develop in the future?
The leading causes of the burden of disease are different for men and women. This is the case for both 2015 and the future, as shown by the Trend Scenario. The burden of disease is expressed in DALYs (Disability-Adjusted Life Years), a measure of healthy life years that are lost to disease (years lived with disability) or premature death (years of life lost). For men the leading cause of disease burden in 2015 was coronary heart diseases, and this will remain the case in 2040. For women the leading cause of disease burden will shift from stroke in 2015 to dementia in 2040. The burden of disease caused by dementia will also increase significantly for men in the future.
The increase in the burden of disease caused by dementia is due to the fact that dementia will be a much more common disease in the future with increased mortality. Dementia is an age-related disease. As women live longer than men, there will be more old women compared to men, and the burden of disease caused by dementia will be greater in women. In both men and women, the burden of disease caused by arthrosis will increase significantly between 2015 and 2040. Among men the burden of disease caused by lung cancer will fall in the future, whereas this will continue to increase among women. This is because, among other things, the fall in the percentage of smokers among women started later than among men and there is a long latency period between the exposure to harmful substances in tobacco products and the development of lung cancer.
These results have been updated in October 2018.
Indicator(s) used: The burden of disease in 2015 and 2040 for the ten diseases that are the leading causes of burden of disease among men and women, based on a selection of 59 diseases. The burden of disease in Disability-Adjusted Life Years (DALYs) is a measure of healthy life years that are lost to disease (years lived with disability) or premature death (years of life lost).
Since the first publication of the burden of disease in the Trend Scenario in October 2017, improved figures have become available. The results for burden of disease are now adjusted for multimorbidity (the occurrence of multiple diseases at the same time). Compared to the previous results, the ranking of diagnosis groups changed.
Source(s) used (in Dutch): The burden of disease calculated by RIVM on the basis of various sources. Further information can be found in the description of the methods of the Trend Scenario.
Further information:
- Methods, backgrounds and additional data.
- Trend Scenario section 'What diseases will we have in the future?'
In the future dementia will be the leading cause of burden of disease among women, coronary heart diseases among men

How will inequalities in lifestyle develop in the future?
In the Trend Scenario, overweight increases in all educational groups in the period up to 2040. In the future, the proportion of people aged 25 years and over who are overweight (Body Mass Index (BMI) higher than 25) will remain the greatest among low-educated people. However, the differences in the proportion of those overweight between educational groups will be smaller compared with the current difference in the proportion of those overweight. There may be a ceiling effect for low-educated people (see graph). This projection is based on the historical trend from 1990 to 2015 in the occurrence of overweight. In this period the percentage of adults who are overweight rose, but over the last few years the trend has become slightly less clear. From 2010, there appeared to be a stabilisation in the increase of those overweight in the total population, but from 2014 the percentage of adults who were overweight again appeared to increase slightly (not shown in graph).
Indicator(s) used: Percentage of people (25+) who are overweight (BMI≥25) by educational level. BMI is based on the ratio between height and weight.
Source(s) used (in Dutch): Statistic Netherlands (CBS) Health Survey (1990-1996); POLS health and wellbeing (1997-2009); CBS Health Survey (2010-2013); Health Survey / Lifestyle Monitor, CBS in collaboration with RIVM (from 2014), data processed by RIVM.
Further information:
- Methods and backgrounds.
- Trends in overweight (in Dutch) at Volksgezondheidenzorg.info.
- Trend Scenario ‘How (un)healthy will we live our lives in the future?'
In the Trend Scenario the percentage of obese people (BMI ≥ 30) will increase in all educational groups among people aged 25 years and over. Among people of low educational level, the absolute increase will be larger than among high-educated people: among low-educated people obesity will increase from 20 percent in 2015 to 31 percent in 2040 (an increase of 11 percentage points), and among high-educated people from 8 percent in 2015 to 14 percent in 2040 (an increase of 6 percentage points). This applies to both men and women (not shown in graph). Hence, the differences in the proportion of people who are obese between high-educated and low-educated people will be greater in 2040 than in 2015.
Indicator(s) used: Percentage of people (25+) who are obese (BMI≥30) by educational level. BMI is based on the ratio between height and weight
Source(s) used (in Dutch): Statistics Netherlands (CBS) Health Survey (1990-1996); POLS health and wellbeing (1997-2009); CBS Health Survey (2010-2013); Health Survey / Lifestyle Monitor, CBS in collaboration with RIVM (from 2014), data processed by RIVM.
Further information:
- Methods and backgrounds.
- Trend Scenario ‘How (un)healthy will we live our lives in the future?’
The Trend Scenario shows that the percentage of people who smoke will fall in the future among both high-educated and low-educated people aged 25 years and over. Most of these people are daily smokers, but they also include people who smoke occasionally. The percentage of daily smokers will also fall in all educational groups (not shown in graph). This decrease will be the greatest among high-educated people. By implication, the differences in smoking levels between high-educated and low-educated people will increase in the future. In 2015, 17 percent of high-educated people smoked occasionally, and in 2040 this will be 7 percent (a decrease of 10 percentage points). For low-educated people, the proportion of occasional smokers will fall from 27 percent to 19 percent (a decrease of 8 percentage points). In 2040, the percentage of smokers among low-educated people will therefore almost triple the percentage among high-educated people. Among the entire population, the percentage of smokers will fall in the Trend Scenario from 25 percent in 2015 to 14 percent in 2040 (not shown in graph).
Indicator(s) used: Occasional smoking (including daily smoking).
Source(s) used (in Dutch): Statistics Netherlands (CBS) Health Survey (1990-1996); POLS health and wellbeing (1997-2009); CBS Health Survey (2010-2013); Health Survey / Lifestyle Monitor, CBS in collaboration with RIVM (from 2014), data processed by RIVM.
Further information:
- Methods and backgrounds.
- Trend Scenario ‘How (un)healthy will we live our lives in the future?’
Smoking will decrease in the future in all socio-economic groups, overweight will increase

How will regional inequalities in health and the determinants of health develop in the future?
In 2040 life expectancy will still be at its lowest in several major cities and areas with a shrinking population
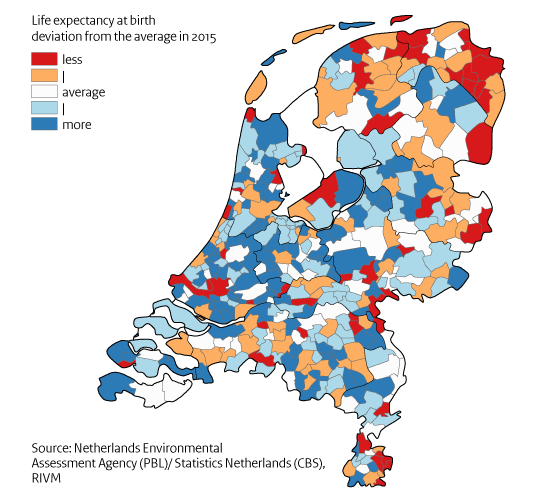
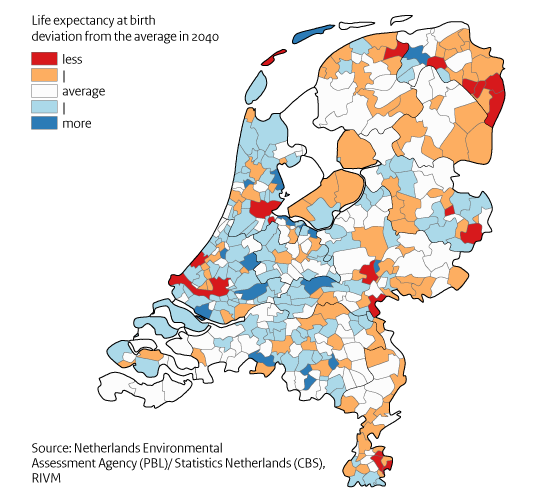
The Trend Scenario also shows significant differences in life expectancy at birth in the future between municipalities. The differences in life expectancy will then vary between 4.4 years below average life expectancy and 3.7 years above average life expectancy. These differences are to some extent comparable to the size of the differences in 2015 (3.3 years below the average and 5.3 years above the average). Several major cities and regions with a shrinking population are part of the municipalities that are the most below the average in 2040. These already have the lowest life expectancy now. So this shortfall will remain in the Trend Scenario in the future. The future projections are based on the regional trends in life expectancy between 1990 and 2014.
Indicator(s) used: Life expectancy at birth by municipality.
Source(s) used (in Dutch): Netherlands Environmental Assessment Agency (PBL) / Statistics Netherlands (CBS) regional population and household forecast for 2016, data processed by RIVM.
Further informtion:
- Methods and backgrounds.
- Regional population by the PBL (in Dutch).
- Trend Scenario 'How old will we get in the future?'
Air quality will improve in the future; local differences will remain
Virtually everywhere in the Netherlands the European Standards for air quality are now being met. Nevertheless, there are still negative effects on health caused by air pollution components such as particulate matter (PM10, PM2.5, PM0.1), NO2 and soot. For instance, with the current concentrations particulate matter (PM10) reduces life expectancy by on average nine months and NO2 by four months. The concentration of PM10 was reasonably uniformly distributed over the Netherlands in 2015, with a few locally elevated levels. High local particulate matter concentrations can be related to local activities such as the storage and transhipment of dry bulk goods in the ports, and by poultry stalls and fertiliser emissions in the agricultural sector as well as by the incineration of biomass such as wood, or by intensive traffic. In the future, the air will become cleaner and the concentrations of PM10, PM2.5, NO2 and soot will fall. Nevertheless, regional variations will remain as a result of local conditions such as agricultural activities, traffic, households or industry and local incidents.
Indicator(s) used: Concentration of PM10 in micrograms per cubic metre.
Source(s) used (in Dutch): Velders GJM et al., 2016. Large-scale Concentation and Deposition Maps for the Netherlands. Bilthoven: National Institute for Public Health and the Environment (RIVM); Health benefits arising from clearer air, 2015 (in Dutch).
Further information:
- Methods and backgrounds.
- Definition of air pollution (in Dutch) at Volksgezondheidenzorg.info.
-
Particulate matter in the Compendium for the living environment (in Dutch)
Major cities and regions with a shrinking population will retain a lower life expectancy


This Trend Scenario is part of the Public Health Foresight study 2018 (VTV-2018), and was published in July 2017. In December 2017, Thematic Foresight Studies on Health on Future health care demand, Wider determinants of health and Technology were published. In June 2018, the final products of the VTV-2018 became available. These are Options for Action for selected urgent societal challenges, and a Synthesis including key messages.
The VTV Trend Scenario presents figures about the future. Figures and information about historical trends and the current state of affairs can be found on the websites (in Dutch) De Staat van Volksgezondheid and Volksgezondheidenzorg.info.