
Diseases
What diseases will we have in the future?

The main developments in the Trend Scenario
Question 1: How many people will have a chronic disease in the future?
- In 2015, 50 percent of Dutch people had at least one chronic disease; in 2040 this will be 54 percent.
- In 2040, one in three Dutch people will have two or more chronic diseases, and almost one in five will have three or more.
- Not everybody with a chronic disease will see their general practitioner (GP) every year, and most people will feel healthy and will not experience activity limitations.
Question 2: What diseases will be the most common in 2040?
- Just as in 2015, neck and back complaints, arthrosis, and diabetes will be the most common diseases in 2040.
- Arthrosis and diabetes are also among the diseases that will increase the most; in addition, the number of people with visual impairments and coronary heart diseases will increase substantially by 2040.
Question 3: What diseases will be the leading causes of burden of disease in 2040?
- Cancer, cardiovascular diseases and mental disorders will be the diagnosis groups that are the leading causes of burden of disease in 2040.
- Two specific diseases, i.e. dementia and arthrosis will cause the biggest increase in burden of disease by 2040, and dementia will be the major cause.
- Although very few people die of mood disorders and anxiety disorders, these disorders will be major causes of burden of disease.
Question 4: What are the trends in infectious diseases?
- The risk of measles outbreaks will be increasing because of falling vaccination coverage.
- Antimicrobial resistance poses a major threat to global public health.

How many people will have a chronic disease in the future?
As a result of population growth and the ageing of the population, the percentage of people who are registered with a general practitioner (GP) with one or more chronic diseases will rise in the Trend Scenario from 50 percent (8.5 million) in 2015 to 54 percent (9.8 million) in 2040. If adding up long-term diseases and chronic ones, the number of people with at least one chronic or long-term disease will rise from 11 million in 2015 to 12 million in 2040. The percentage of people who have just one chronic disease will fall slightly from 25 percent in 2015 to over 23 percent in 2040. The percentage of people with more than one chronic disease will therefore rise (see next graph). These figures are a reflection of the people who have ever been registered in their GP’s files with a chronic disease. They do not provide any information about the amount of health care that people use for their diseases, how healthy people feel or to what extent they experience activity limitations.
Indicator(s) used: Percentage of people who are registered with their GP with at least one chronic disease on 1 January of the year in question (point prevalence).
Source(s) used (in Dutch): NIVEL Primary Care Database , data processed by RIVM.
Further information:
As a result of the ageing of the population, the Trend Scenario shows an increase in the percentage of people who have multiple diseases (multimorbidity). This is because the elderly more often have several coexisting diseases than young people. The percentage of people who are registered with their GP with two or more chronic diseases will increase from almost 25 percent (4.3 million people) in 2015 to 30 percent (5.5 million) in 2040. This increase is largely attributable to the group with three or more chronic diseases. For this group, the percentages are 14 percent (2.4 million people) in 2015 and 18 percent (3.3 million people) in 2040. In 2015, 50 percent of Dutch people had no chronic diseases. This percentage will fall to 46 percent in 2040. Both in 2015 and 2040 this amounts to 8.4 million people; because of the population growth, the absolute number will remain the same despite the falling percentage.
Indicator(s) used: Percentage of people who are registered with their GP by number of chronic diseases on January 1 of the year in question (point prevalence).
Source(s) used (in dutch): NIVEL Primary care database, data processed by RIVM.
Futher information:
Not everybody with a chronic disease will see their general practitioner (GP) every year, and most people will feel healthy and will not experience activity limitations
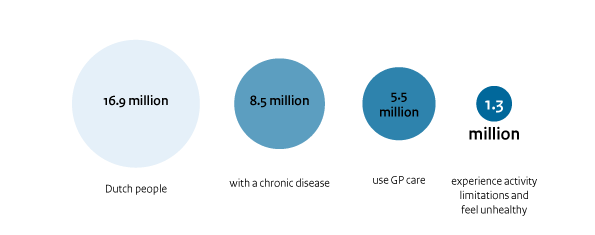
Only part of the people who are registered with a chronic disease, visit their GP for this disease. On January 1, 2015, 8.5 million people had one or more chronic diseases recorded in their GP’s files. Of these, 5.5 million people contacted their GP in 2015 about this/these chronic disease(s). In 2015, there were approximately 1.35 million people with a chronic disease who also experienced activity limitations and poorer health. This is 16 percent of the people who have a chronic disease. Most of the people with a chronic disease feel healthy and experience no activity limitations (59 percent). The rest of those with a chronic disease feel either unhealthy or experience activity limitations.
Indicator(s) used: Number of people who were registered with their GP with at least one chronic disease on January 1, 2015 (point prevalence), number of people who contacted their GP in 2015 about a chronic disease (care prevalence), number of people with a chronic disease, activity limitations and perceived poor health.
Source(s) used (in Dutch): NIVEL Primary Care Database; Adults Health Monitor, Municipal Health Services, Statistics Netherlands (CBS) and RIVM, 2012.
Futher information:
In 2040, over half of people will have at least one chronic disease

What diseases will be the most common in 2040?
In the Trend Scenario, the future top ten most common diseases will be the same as the current top ten. Just as in 2015, the most common diseases in 2040 will be arthrosis, neck and back complaints and diabetes. Most of the diseases in the graph are age-related diseases. Due to the ageing of the population, they will become more common in the Trend Scenario. The future increase in arthrosis will also be caused by the continuation of a historical trend. Anxiety disorders are not age-related and, therefore, the future increase in anxiety disorders will be relatively low. Many of the diseases in the top ten are also related to lifestyle. However, the effect of future developments in lifestyle is not included in this projection, but these could affect the future occurrence of diseases. The top ten ranking is based on a selection of 59 major diseases. The selection is based on the occurrence of the diseases and not on their severity. Diseases that will occur frequently in 2040, but that are outside the top ten include stroke, mood disorders and dementia.
Indicator(s) used: The number of people in 2015 and 2040 with a specific disease. The number of people with a specific disease is operationalised in various ways depending on the nature of the disease (annual incidence, annual prevalence, 10-year prevalence).
Source(s) used (in Dutch): Sources used for the operationalisation of the number of people with a specific disease are NIVEL Primary Care Database; NEMESIS; Dutch Cancer Registration; Injury Information System.
Futher information:
As we are simultaneously faced with a population growth and the ageing of the population, most diseases in the Trend Scenario will occur more often in 2040 compared to 2015. Arthrosis, visual impairments and diabetes show the greatest increase. Thus, in 2040 there will be over a million more people with arthrosis than in 2015. Apart from the ageing of the population, the substantial increase in arthrosis is caused by the increasing historical trend that is assumed to continue in the future. This trend can possibly be explained by an increase in overweight in the population. The number of people with dementia will rise from 154,000 in 2015 to 330,000 in 2040 (not shown in graph). Although the increase in the occurrence of some other diseases is greater, dementia will be the leading cause of the increase in the burden of disease by 2040. Just as in the previous graph this ranking is based on a selection of 59 major diseases.
Indicator(s) used: Top twenty diseases with the greatest absolute increase in occurrence between 2015 and 2040. The number of people with a specific disease is operationalised in various ways depending on the nature of the disease (annual incidence, annual prevalence, 10-year prevalence).
Source(s) used (in Dutch): Sources used for the operationalisation of the number of people with a specific disease are NIVEL Primary Care Database; NEMESIS; Dutch Cancer Registration; Injury Information System.
Futher information:
Age-related diseases will be the most common diseases in 2040, too

What diseases will be the leading causes of burden of disease in 2040?
Just as in 2015, cancer and cardiovascular diseases will be the diagnosis groups that will be the leading causes of burden of disease in 2040. The burden of disease is expressed in DALYs (Disability-Adjusted Life Years), a measure of healthy life years that are lost due to disease (years lived with disability) or premature death (years of life lost). By 2040, the diagnosis group mental disorders will have pushed diseases of the musculoskeletal system from third place. The great increase during the period 2015-2040 in mental disorders and diseases of the nervous system and senses is mainly attributable to a large rise in deaths due to dementia. There are different types of dementia and these fall under either mental disorders or diseases relating to the nervous system and senses.
These results have been updated in October 2018.Indicator(s) used: Burden of disease according to ICD Main Group or chapter. Burden of disease in Disability-Adjusted Life Years (DALYs), a measure of healthy life years that are lost due to disease (years lived with disability) or premature death (years of life lost).
Source(s) used: Burden of disease calculated by RIVM on the basis of various sources.
Since the first publication of the burden of disease in the Trend Scenario in October 2017, improved figures have become available. The results for burden of disease are now adjusted for multimorbidity (the occurrence of multiple diseases at the same time). Compared to the previous results, the ranking of diagnosis groups has changed.Futher information:
In the Trend Scenario the diseases that will dominate the top ten of disease burden in 2040 will be the same as those in 2015, although their position on the list may shift. In 2040, dementia will head the list and coronary heart diseases and arthrosis will be in second and third place. Particularly striking is the large increase in the burden of disease caused by dementia and arthrosis. The main explanation for dementia is a large rise in deaths and for arthrosis it is a large rise in the occurrence of this disease. The ranking is based on a selection of 59 major diseases.
These results have been updated in October 2018.Indicator(s) used: Top ten diseases that are the major causes of disease burden in 2015 and 2040, based on a selection of 59 diseases. Burden of disease in Disability-Adjusted Life Years (DALYs), a measure of healthy life years lived with a disability (years lived with disability) or premature death (years of life lost).
Source(s) used: Burden of disease calculated by RIVM
Since the first publication of the burden of disease in the Trend Scenario in October 2017, improved figures have become available. The results for burden of disease are now adjusted for multimorbidity (the occurrence of multiple diseases at the same time). Compared to the previous results, the ranking of diagnosis groups has changed.
Further information:
The DALY (Disability-Adjusted Life Year) is a measure of healthy life years that are lost to disease (years lived with disability) or premature death (years of life lost). The graph shows the diseases that will be the leading causes of burden of disease in 2040. For most of these diseases, loss of healthy years is the main driver of disease burden. For, for example, anxiety and mood disorders this is almost 100 percent. In the case of lung cancer, almost the entire burden of disease is due to premature death; only 3 percent of the total number of DALYs for lung cancer in 2040 will be caused by a loss of healthy years. Similarly, in the case of dementia a relatively large part of the burden of disease will be caused by premature death (72 percent). Just as in the previous graph, this ranking is based on a selection of 59 major diseases.
These results have been updated in October 2018.
Indicator(s) used: Top ten diseases in 2040 that are the leading causes of the burden of disease, based on a selection of 59 diseases. Burden of disease in Disability-Adjusted Life Years (DALYs), a measure of healthy life years lived with a disability (years lived with disability) or premature death (years of life lost).
Since the first publication of the burden of disease in the Trend Scenario in October 2017, improved figures have become available. The results for burden of disease are now adjusted for multimorbidity (the occurrence of multiple diseases at the same time). Compared to the previous results, the results of the YLD are lower.
Source(s) used: Burden of disease calculated by RIVM on the basis of various sources.
Further information:
In 2040, dementia will be the leading cause of burden of disease

What are the trends in infectious diseases?
The vaccination coverage for mumps, measles and rubella (MMR) shows a slightly downward trend. The WHO standard of 95% for the first MMR vaccination, required for the elimination of measles, is now no longer being met in the Netherlands (see figure). The recommended age for the first MMR vaccination is 14 months and for the second 9 years. A high vaccination coverage ensures that vulnerable unvaccinated (or not yet vaccinated) children are protected against measles (group protection). A falling vaccination coverage increases the risk of outbreaks. This risk is at its greatest for measles as this is an extremely infectious disease with potentially serious consequences. The same slight fall can also be seen for other vaccinations in the Dutch Immunisation Programme. A general fall in vaccination coverage can be seen in all Municipal Health Service regions (not shown in graph). There are probably several causes for this.
Indicator(s) used: Vaccination coverage for first and second MMR vaccination in two- and ten-year-olds (recommended age 14 months and 9 years).
Source(s) used: RIVM-DVP; Praeventis national immunisation register.
Futher information (in Dutch):
Antimicrobial resistance poses a major threat to global public health
Across the globe, increasing numbers of bacteria are developing a resistance to antibiotics. This means that some infections are difficult to treat or cannot be treated at all. This could cause major health risks in the future. By reducing the use of antibiotics, we may be able to control the spread of resistant bacteria. It is also important that we continue to develop new antibiotics in order to be able to treat infections due to resistant bacteria.
The approach taken to tackling antimicrobial resistance focuses on the areas health care, livestock farming, food and the environment. This is called the ‘One Health’ approach. The main focus is on health care (in particular of vulnerable people) and livestock farming. Specific measures are being taken in each area. For instance, antibiotic consumption by people has remained stable over the last few years in the Netherlands. In livestock farming, antibiotic consumption has even dropped by over 60% over the last seven years. The number of resistant bacteria found in people has remained stable over the last few years in the Netherlands. However, in a lot of other countries, this is not the case (see map for an example). As antimicrobial resistance does not recognise borders, international collaboration is a priority.
Indicator(s) used: Percentage of isolates of Klebsiella pneumoniae that tested positive for carbapenem resistance (this is the number of positive isolates relative to the number of tested isolates of patients). Carbapenem is an antibiotic.
Source(s) used (in Dutch): ECDC Surveillance Atlas.
Further information:
- NethMap 2016 (Consumption of antimicrobial agents and antimicrobial resistance among medically important bacteria in the Netherlands) /Maran 2016 (Monitoring of Antimicrobial Resistance and Antibiotic Usage in Animals in the Netherlands in 2015).
- RIVM Centre For Infectious Disease Control: Strategy 2016-2021 (in Dutch).
- Antimicrobial Resistance at rivm.nl.
Antimicrobial resistance and falling vaccination coverage are public health risks


This Trend Scenario is part of the Public Health Foresight study 2018 (VTV-2018), and was published in July 2017. In December 2017, Thematic Foresight Studies on Health on Future health care demand, Wider determinants of health and Technology were published. In June 2018, the final products of the VTV-2018 became available. These are Options for Action for selected urgent societal challenges, and a Synthesis including key messages.
The VTV Trend Scenario presents figures about the future. Figures and information about historical trends and the current state of affairs can be found on the websites (in Dutch) De Staat van Volksgezondheid and Volksgezondheidenzorg.info.